Published by City Farmer, Canada's Office of Urban Agriculture

City Farmer Uses the Latest Aerial Photos To Find Out How Much Food is Grown in the City of Vancouver
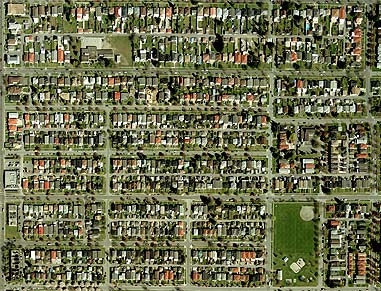
Looking down from the sky it's easy to see where city farmland lies. Roofs, driveways, sidewalks, swimming pools, trees, lawns and gardens are all clearly visible.
By Michael Levenston, Jennifer Blecha, Kate Schendel and Jayna Houston
September, 2001
Twenty years ago in our article Arable Acres Within City Limits, City Farmer attempted to see how much land was available for growing food in the City of Vancouver. We made estimates based on City planning documents.
Once again we are attempting to look at the food growing potential in our City but this time using the latest aerial photos. A good quality image showing a close-up view of an urban neighbourhood can give us a surprising amount of information.
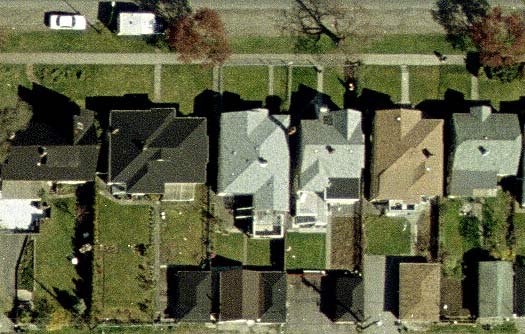
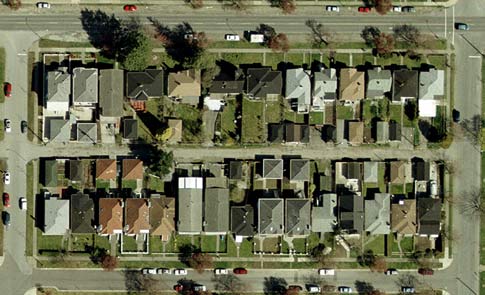
The photos on this page were taken of homes in South Vancouver between Fraser and Clarke Avenues. The excellent resolution of the shots (15cm = 1 pixel) allows us to close in from an airplane-view to an almost tree-top view of homes and gardens. Most aerial photos of our City have previously been shot at 100cm = 1 pixel which doesn't allow for the same kind of observation.
Using GIS (Geographic Information System) analysis on geo-referenced images, we are measuring the size of lots, area of buildings, sidewalks, lawns and gardens in order to get a more accurate reading of the area presently being used to grow food and the potential area which could be used if lawns and other landscaped areas were converted.
In addition to GIS mapping, we are doing visual assessments on the ground of the properties in the photos. As well, we are conducting personal interviews (questionaires) of Vancouver residents.
We hope that people in other cities around the world will begin to do similar rersearch in order to better document the urban agriculture potential within metropolitan areas.
Analysis of Food Growing Potential for Pilot Block in Vancouver
by Jayna Houston
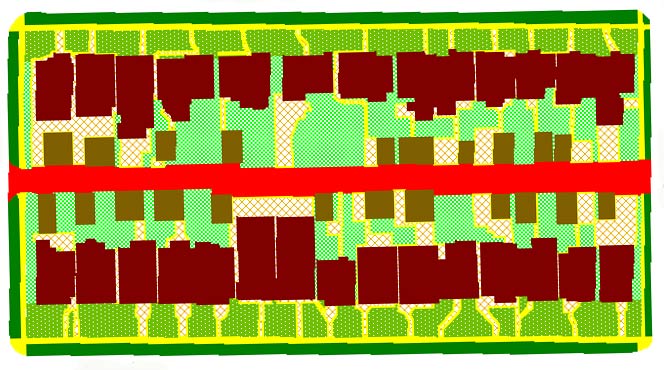
The chosen area of Vancouver (a block including 28 homes in South Vancouver) was analysed utilizing a Geographic Information System (GIS) and recent orthophotos, in order to determine the potential for food growing space within the block. The analysis included an area covered by buildings, pavement, and landscape.
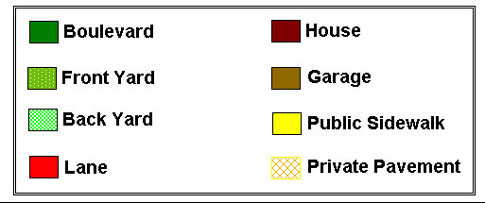
The area was mapped using seven land use categories, two of which were divided into two further categories. The specific categories chosen were based on discussions with City Farmer staff as well as categories typically used for analysis of impervious surface area. All mapping was based on the author's interpretation of the orthophotos in conjunction with ground-based verification of selected regions within the block.
It should be noted that the values obtained from this analysis are estimations. For example, the orthophoto shows the backyard of the house on one corner to be largely covered by pavement but it was discovered, upon "ground-truthing" (visiting the neighbourhood in person), that the pavement has been removed and the yard is currently covered by exposed soil and building supplies. Because it is unknown under which land use category this yard will eventually be covered, it has been mapped as pavement, as per the orthophoto. This could lead to a slight error in the area covered by pavement. Another area that leads to mapping difficulties is the space between houses. Land use between houses is not visible on the orthophotos due to scale and shadows. Ground-based verification led to the determination that much of the land between houses is covered by pavement. Since this mapping project covered a relatively small area, ground-truthing was feasible and mapping errors were minimized.
The land use categories defined as Front and Back were delineated at the front corners of adjacent houses. The lane boundary was delineated largely at fence lines, therefore, some vegetation exists within the lane but conditions are such that growing potential would likely be negligible.
Results:
The total potential growing area was determined to be 47,480 sq. ft. which represent nearly 32% of the area within the entire block. This is based on the area values for the land use categories Front unpaved and Back unpaved. This area represents land that is presently covered by lawns, gardens or bare soil. A greater detail of results has been tabulated and included below.
|
Land Use |
Area |
Percent of |
|
(sq. ft.) |
Total Area |
|
|
Total Block Area |
149000 |
|
|
Lane |
12380 |
8.3 |
|
Boulevard |
12870 |
8.6 |
|
House |
40130 |
26.9 |
|
Garage |
10110 |
6.8 |
|
Public sidewalk |
7440 |
5.0 |
|
Front pavement |
4190 |
2.8 |
|
Back pavement |
14400 |
9.7 |
|
Front unpaved |
21560 |
14.5 |
|
Back unpaved |
25920 |
17.4 |
Editor:
In this particular block of Vancouver, 1/3 of the total area is landscaped and has potential for food growing. Some of this area will be shaded and not suitable for all crops but additional areas such as paved surfaces, balconies and decks can be used for container gardening.
VanMap
"VanMap is a Web-based map system that lets you have Vancouver at your fingertips. VanMap doesn't just offer street names and intersections; for example it can show you, property lines, zoning information, sewer mains, water mains, addresses, public places."
Are you worried about 70-642 pdf and mb5-858 vce? Check out our latest resources like 70-643 vce and exam 70-433 questions for practice with definite guarantee of 70-659 pdf dumps.
![[new]](new01.gif)
